Table of Contents
Performance Monitoring
Click here for information about performance monitoring on RT.
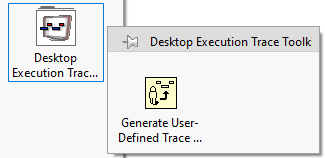
Desktop Execution Trace Toolkit
The Desktop Execution Trace Toolkit (DETT) can help to identify performance issues.
Getting Started
-
download a version, which is compatible
-
allow communication between LabVIEW and DETT via VI Server adding localhost to the machine access list (Tools → Options → VI Server)
-
open your LV project and the VI you want to analyse
-
in the DETT, select your project from the Application Instance dropdown
-
configure the events you want to trace from the Capture Settings menu
-
hit the green start button
-
start your VI / application
Tipps
-
start with capturing Memory Allocations and Reference Leaks
-
add user defined trace events to follow the program sequence

